"Cocktail"
Description
In this project, I am going to apply the cocktail API, and the API link is "https://www.thecocktaildb.com/api/json/v1/1/search.php?f=a". As I love drink cocktail usually, and I want to know about the description of each cocktail and the categories of margarita of the cocktail, so that is the inspiration came from.
Design Process
Sketches of the data
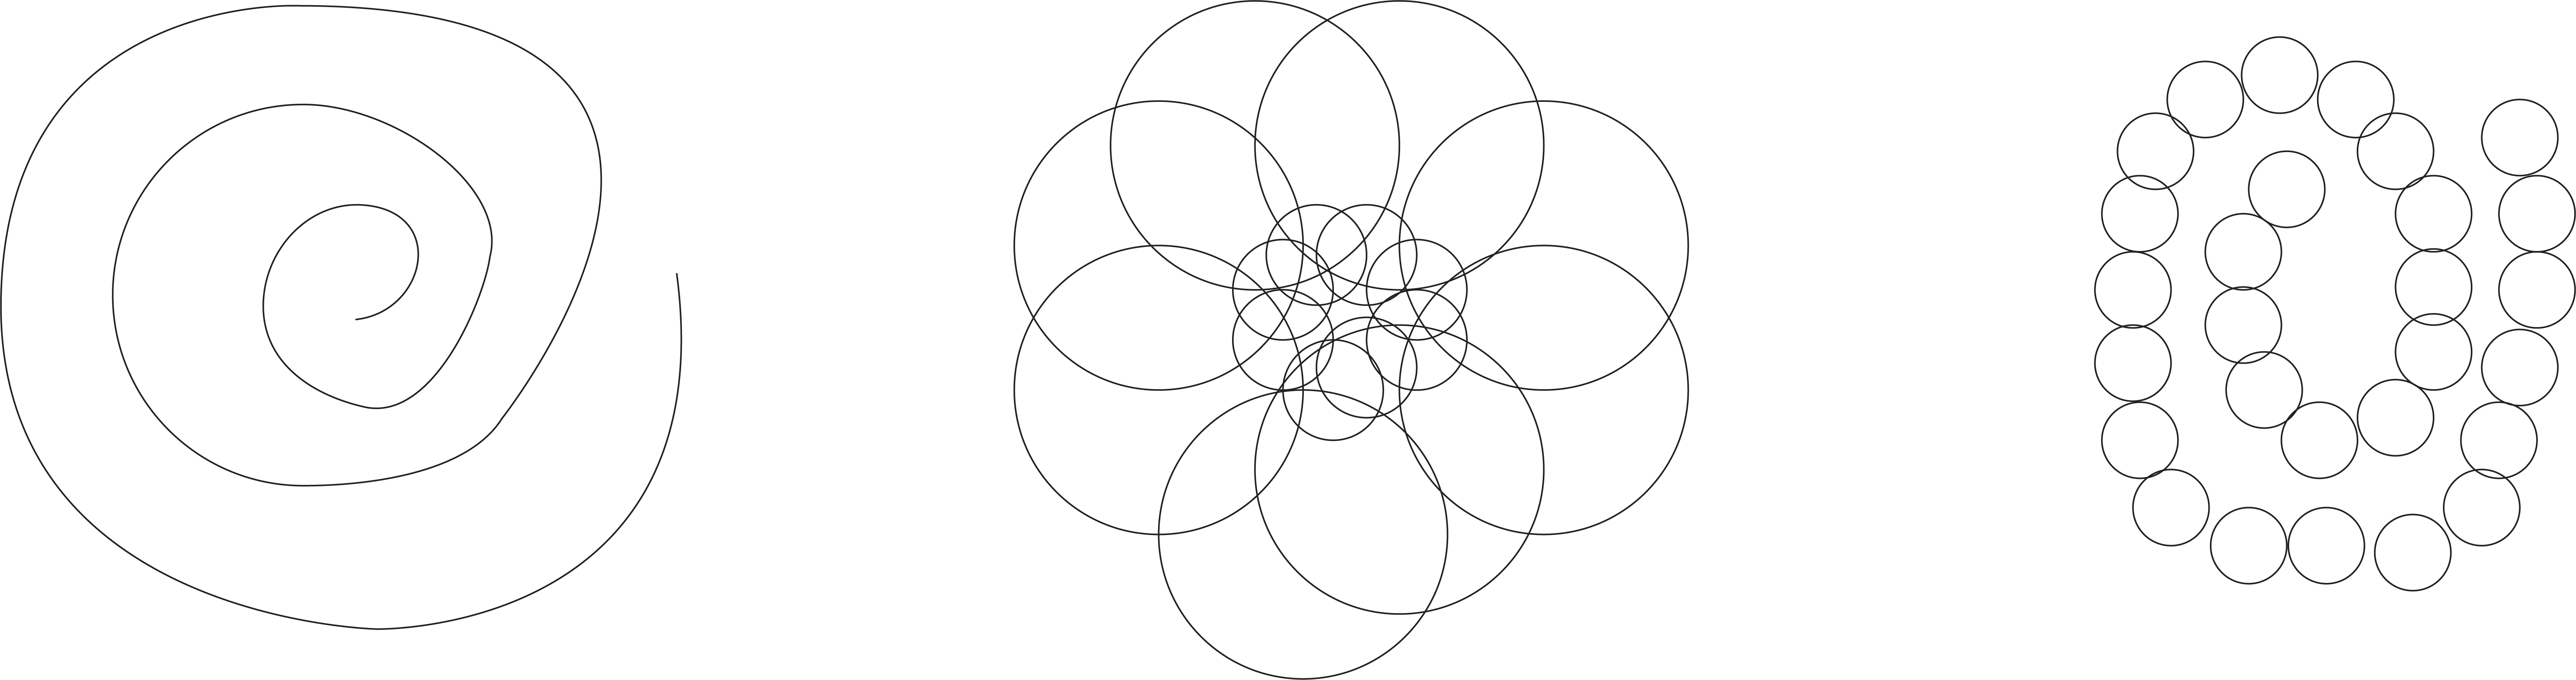
First of all, I am not a person who is good at drawing, but I will try my best!xD. The inspiration for the first draft was when I was washing in the morning, I found that the water was flowing into the sink in a whirlpool shape, and then I thought that the cocktail was also presented by adding different ingredients. So for the first draft, I want to present the data in an inflowing way. In the second draft, I thought that the relationship between cocktails and ingredients is inclusion, so I plan to use the feeling of being wrapped in a small circle. At the same time, because some cocktails use the same ingredients, they will have a cross Feel, express the common point. The third draft is derived from the first draft. Because the first draft is a line, I want to change the line to a different shape in the third draft. Then let the graphics rotate to inject different ingredients, and then produce a cocktail in the final stage.
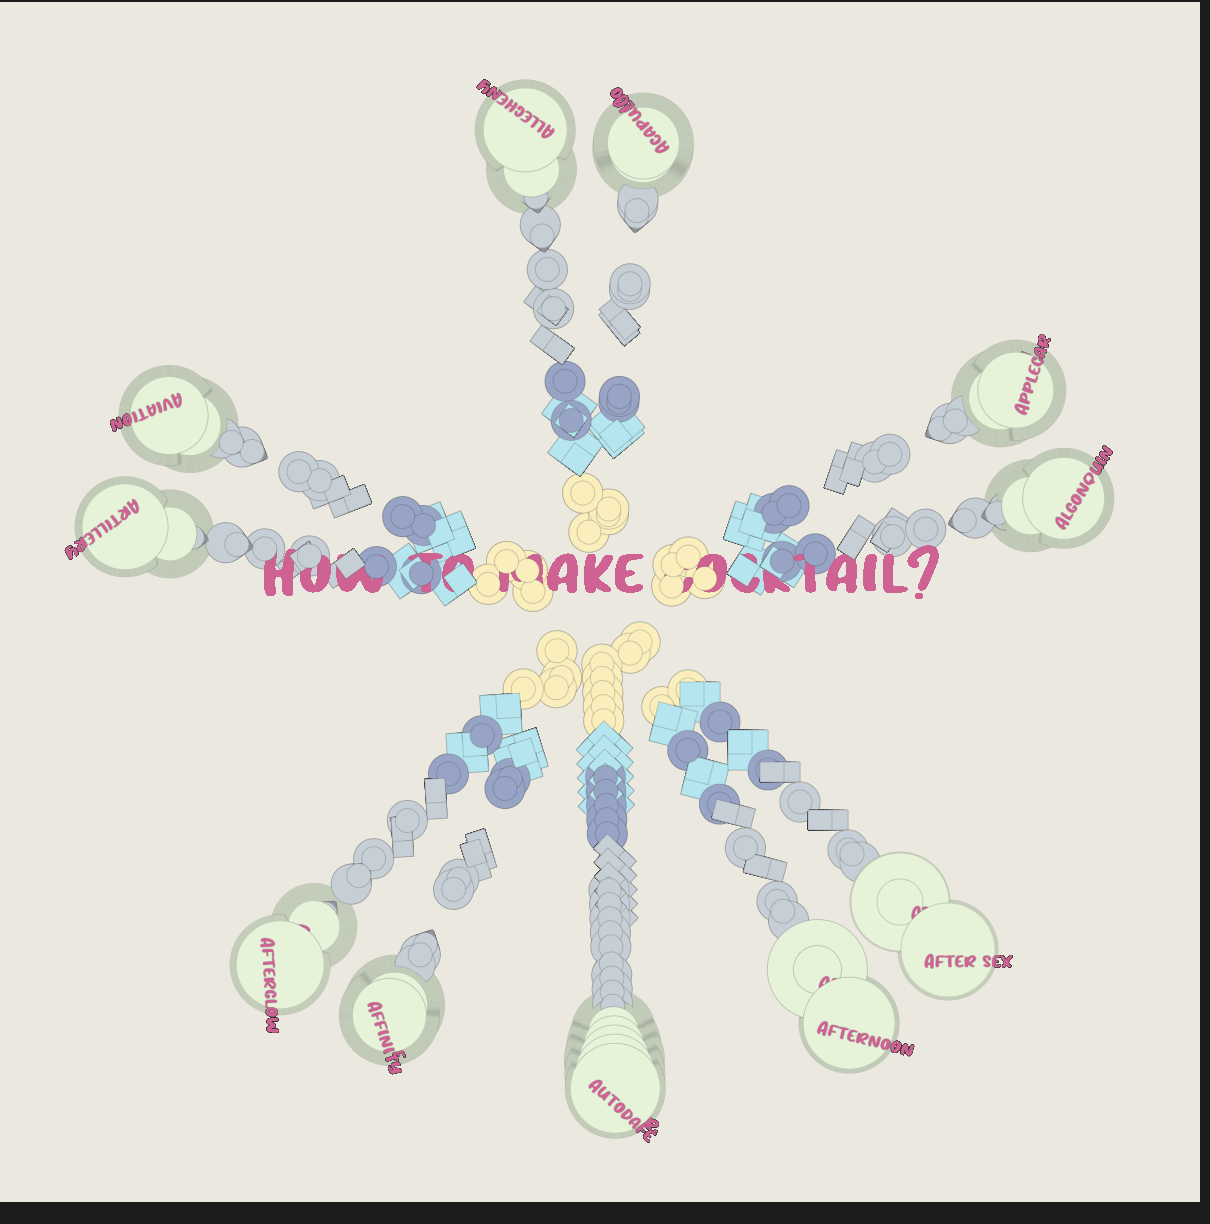
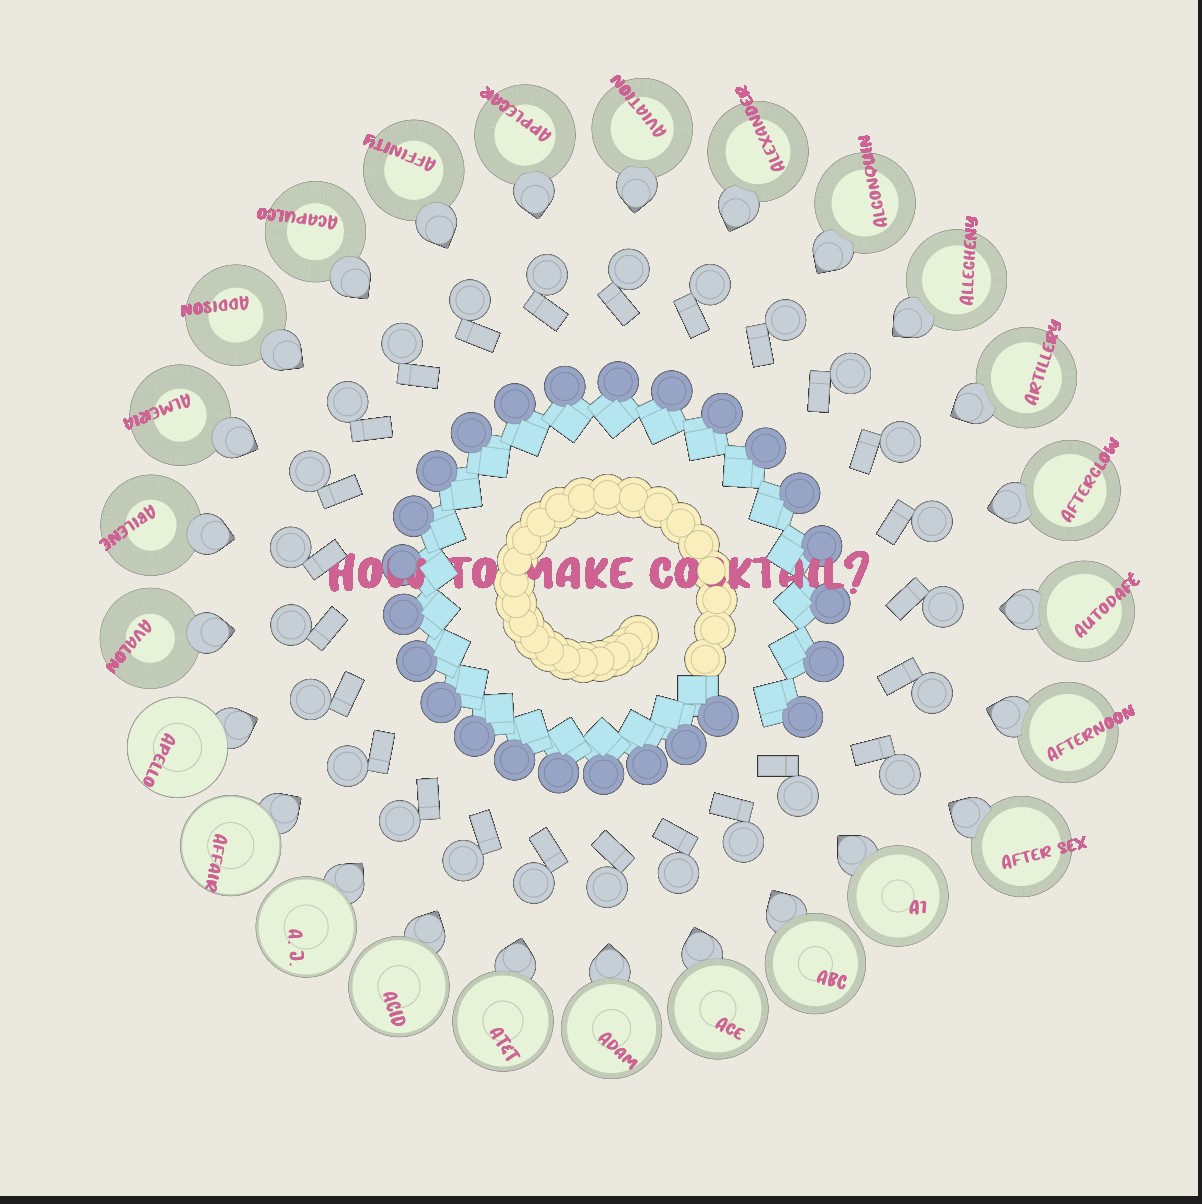
In this project, I choose the cocktail api as my object, since I usually like to drink cocktail, and I really want to know about the cocktail ingredients. Therefore, I selected this as my topic, and I am going to dive deep for the api. after I got the api, I found the cocktails name and ingredients of the cocktail. Then I started to take these 2 elements out and used different shapes to represent the data, but there are too many ingredients, which the most amount is up to 6 ingredients. Therefore, I used same shape to represent the ingredients but in different colors. For the next step, I was thinking that if I could make a animation for the data, and what types of the animation in the data. Therefore, I outputed my data, and I saw some of the data are overlay, because they use the same ingredients, so I add a value of the array number of itself to let all the ingredients out, no matter if they are the same or not. I will put images into the outcomes. I selected the second version as the outcome, which I also use display the cocktail name on the big circle, which is the outest circle.
Reflection
For the reflection, based on the feminist principle of Embrace pluralism, I made the data into an injectable feeling because I want to show the cocktails based on Embrace pluralism through the steps of these ingredients. Just like a tutorial, he let us understand the reason for the cocktails in the data. Which ingredients are composed, so that users can make their own cocktails at home in the future, and it is also a menu, users can choose their favorite cocktails to make. The original data is a lot of text. I want to extract the important part and visualize it, just like the moving graphics in this work. Let the data move, there is a feeling of giving him vitality, which is also a way I like very much when designing. I think how I respond to Embrace pluralism is this data taught me how to make a cocktail in my dail life, which it is multiple perspectives, priority andexperiential ways. As we can make our cocktail on our on based on the list, cocktails can be prepared according to the amount of ingredients you like.